The day, named as it builds.
Opening type, day type, and if/then lines, in plain words.
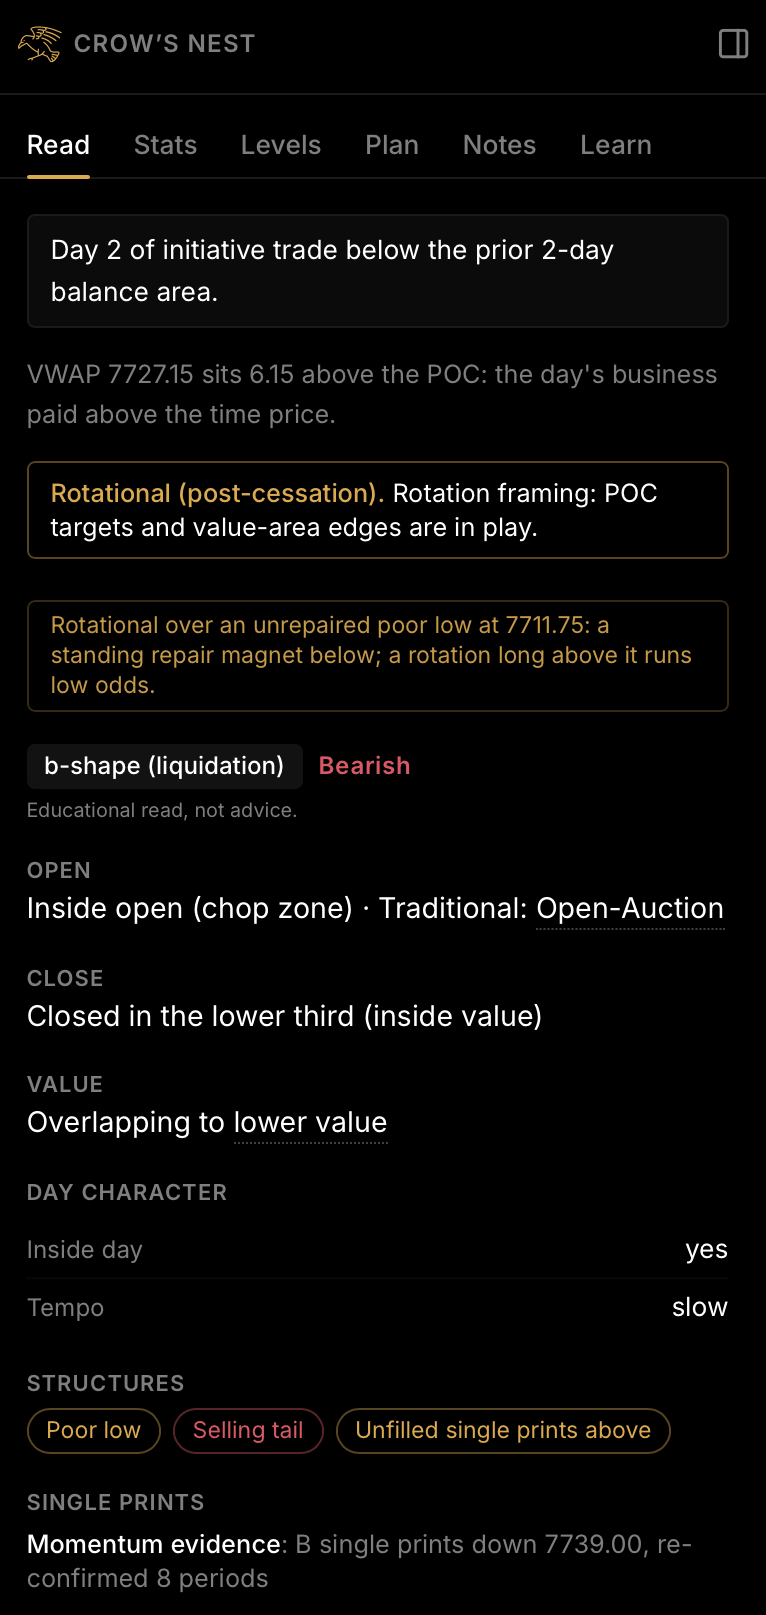
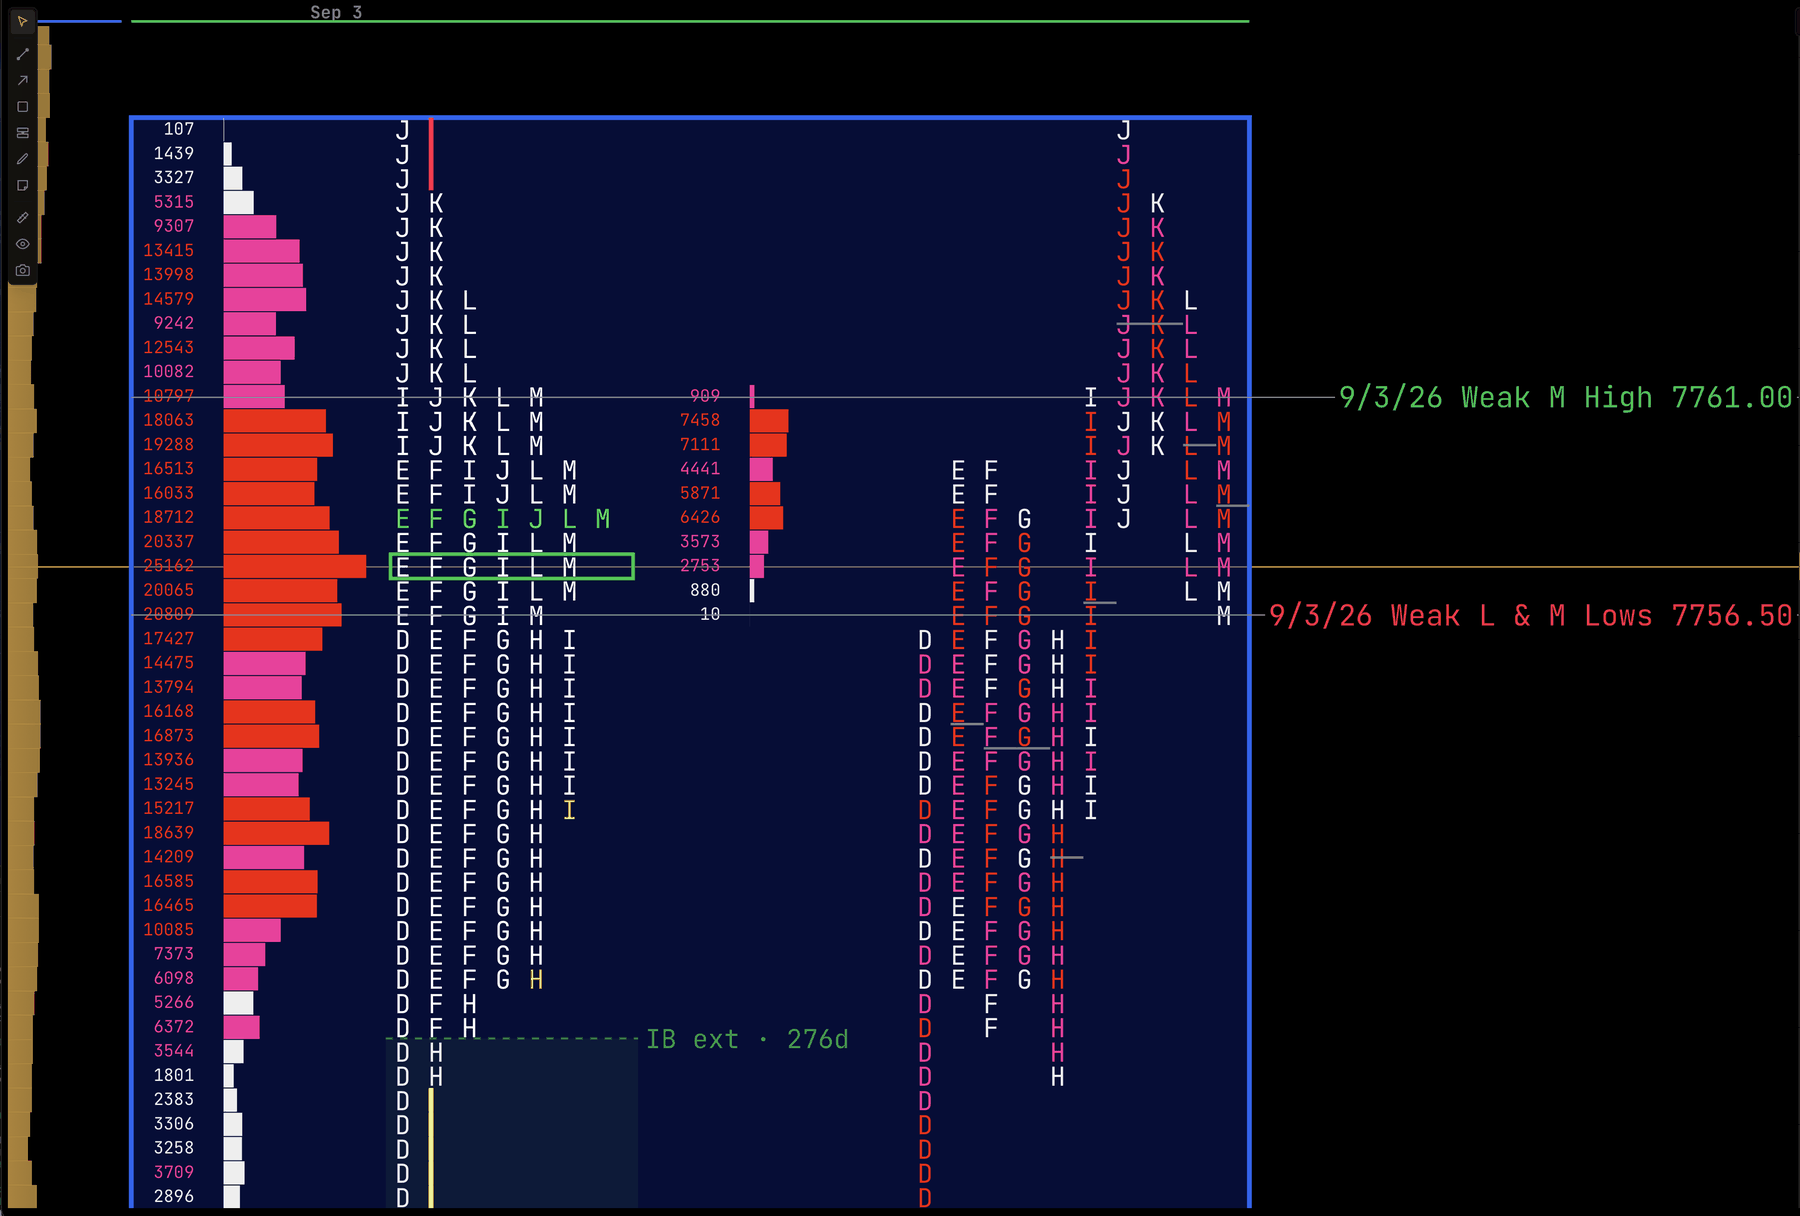
The Crow's Nest sits beside your chart and keeps up as the session builds. Every read is descriptive and traceable: the same for every user looking at the same market, an informed opinion, never a signal.
Opening type, day type, and if/then lines, in plain words.
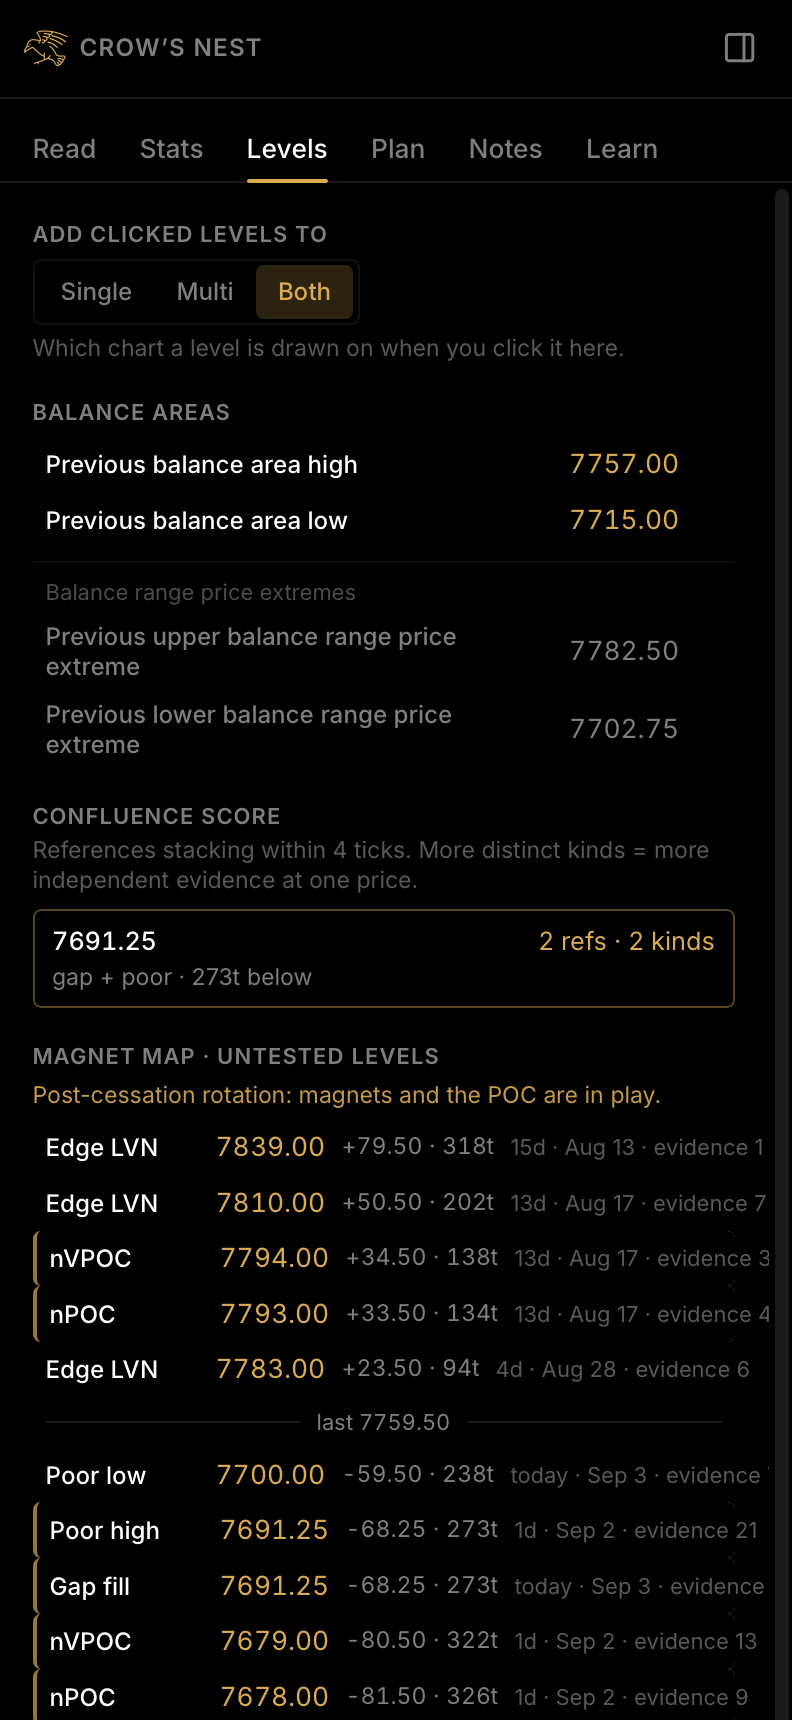
Naked VPOCs, poor highs and lows, gaps, and single prints, each with its distance, age, and evidence.
What happened next after sessions like today, from the history you load.
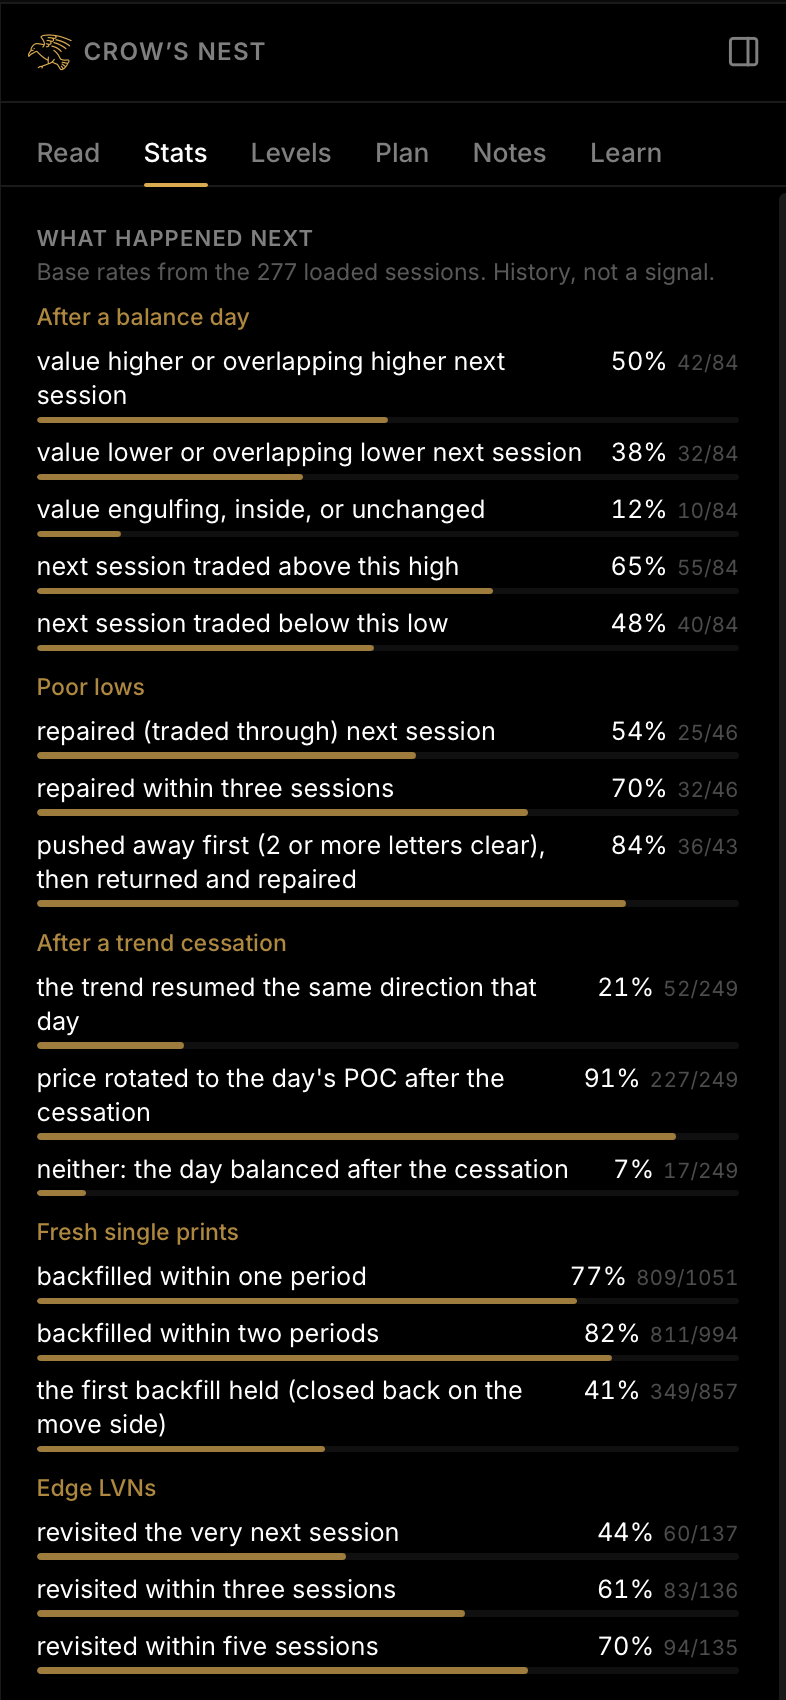
Disclosure: Statistics shown are computed from historical market data and describe the past. Hypothetical or historical results have inherent limitations. They do not represent actual trading, are prepared with the benefit of hindsight, and do not reflect real conditions such as slippage, fees, and liquidity. No representation is made that any account will or is likely to achieve similar results. Sample sizes are shown because small samples mislead.
LIVE SCREENSHOTEducational read, not advice.
LIVE SCREENSHOTES, one session of history loaded
LIVE SCREENSHOTHistorical. Describes the past. Not a prediction or advice.
Disclosure: Statistics shown are computed from historical market data and describe the past. Hypothetical or historical results have inherent limitations. They do not represent actual trading, are prepared with the benefit of hindsight, and do not reflect real conditions such as slippage, fees, and liquidity. No representation is made that any account will or is likely to achieve similar results. Sample sizes are shown because small samples mislead.
Yesterday, the overnight, and today's magnets on one page.
Your own scenarios, watched all session.
Long and short, rated against value. It never says whether to take the trade.
On price and on the app's own levels.
A journal pinned to the chart.
Your calls on the day's key moments, scored.
Play any past day forward, reads and all.
The reading layer stands on the charting, and the charting is included.
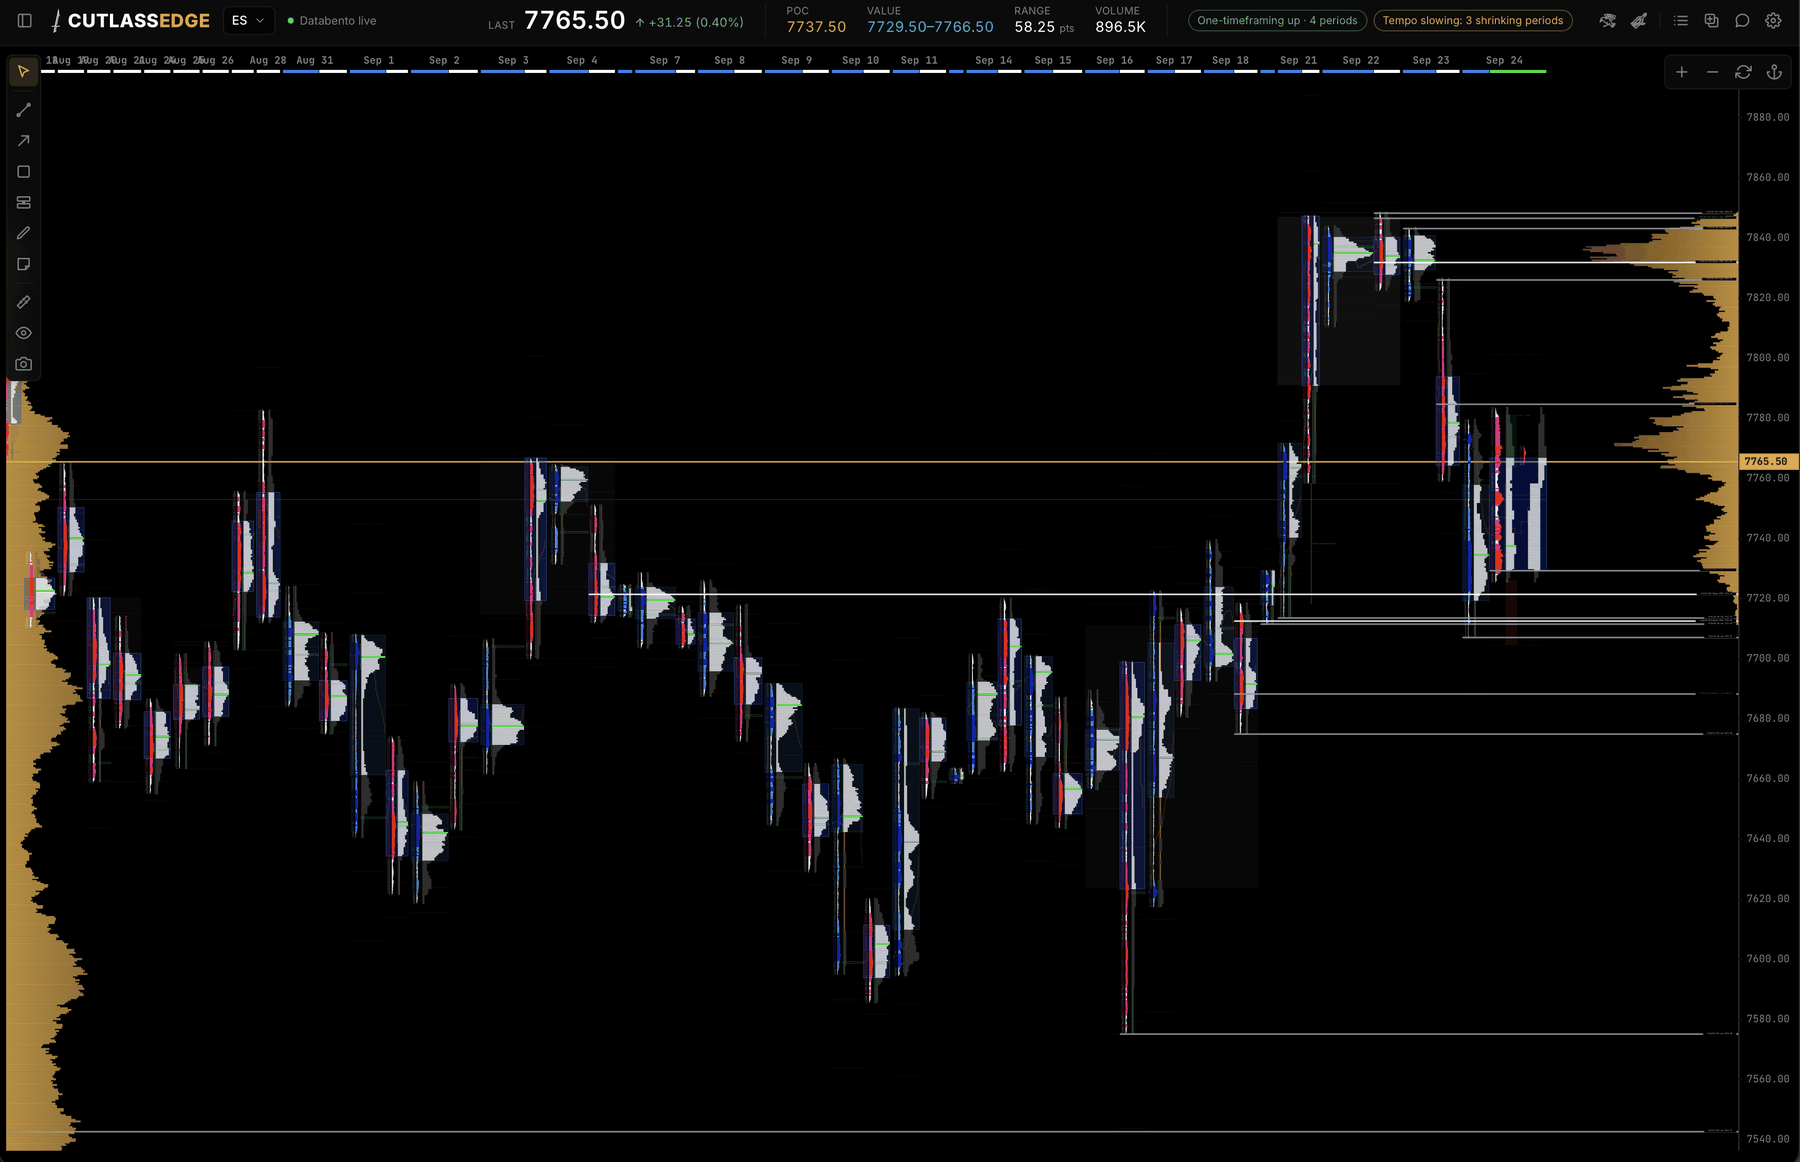
Built by a dyslexic trader, so readability comes first.
Most platforms will draw you a profile. The difference is everything that happens after the drawing.
| What you get | Typical profile charting | CutlassEdge |
|---|---|---|
| TPO and volume profiles, value area, initial balance | Yes | Yes, time and volume side by side |
| Names the opening type and the day type | You do it in your head | As the session builds |
| Marks untested levels with their age and evidence | You draw and maintain them | Automatic, with a confluence score |
| Base rates with the sample size on every number | Not usually | From your own loaded history |
| The five most similar past sessions | Not usually | Ranked by match, with what followed |
| A written plan the app watches and reports on | Not usually | Battle Plan, with outcome tracking |
| A debrief that quizzes you on a finished day | Not usually | Session Debrief, scored |
| Dyslexia-friendly type, spacing, and contrast | Rare | Built in |
| Your data stays on your machine | Varies | Always |
"Typical profile charting" means the profile tools on a general charting platform. Some platforms offer some of these as add-ons or plug-ins; check yours.
$59 a month, or $590 a year
/mo or /yr, $59/mo or $590/yr + VAT
Subscriptions renew automatically at $59 a month or $590 a year until you cancel, plus applicable tax. Founder pricing is open through December 6, 2026. Cancel any time from the customer portal. Customers in the EU: VAT at your country's rate is added to the $59 base price, and your full total is shown before you pay.
No. Every read is written in plain words, and tapping a structure chip shows its definition. The Learn library covers the concepts from the first profile up, and Replay and the Session Debrief let you practice on past days before you ever read one live.
Neither. CutlassEdge describes the auction: what the structure looks like, which levels are untested, and what has historically followed, with the sample size shown. It is the same impersonal, educational read for every user looking at the same market. It never tells you to buy or sell, and the standing line under the read says so.
For the live read, a supported live feed. For study, import CSV history with no account at all, or start with the built-in sample data offline. The Download page lists the supported feeds and what each one enables.
Yes. One license activates on two computers, a desktop and a laptop, say. Switching machines is self-serve: deactivate on the old one, activate on the new one. Your workspaces, notes, and plans live on each computer, and Backup lets you carry them over.
No. Your charts, your history, your notes, and your plans stay on your computer. After activation the app works offline for up to 30 days at a time; it needs a brief connection at least every 30 days to recheck your license.
Yes, any time, from the customer portal, with no hoops to jump through. Refunds follow the Refund Policy.
Subscribe, connect your feed, and CutlassEdge reads the auction from your first session.